A customer reports that a search failed. With Forte, start at the hosted Service's Requests tab: find the failed call, inspect its status and timing, and read the application logs associated with that request. Hosting and request diagnostics are already connected, which reduces the setup and tool switching between a support report and useful evidence.
The example below follows a failed API request through that workflow. Forte supplies the request record and correlation view; your application contributes useful log messages carrying the request ID.
Find the failed call and read its evidence
Forte records the method, path, response status, and latency for requests to Services. Open a Service's Requests tab, filter to the failing route or status, and select the request. When the application emits the Forte request ID, the detail view associates matching application logs with that request.
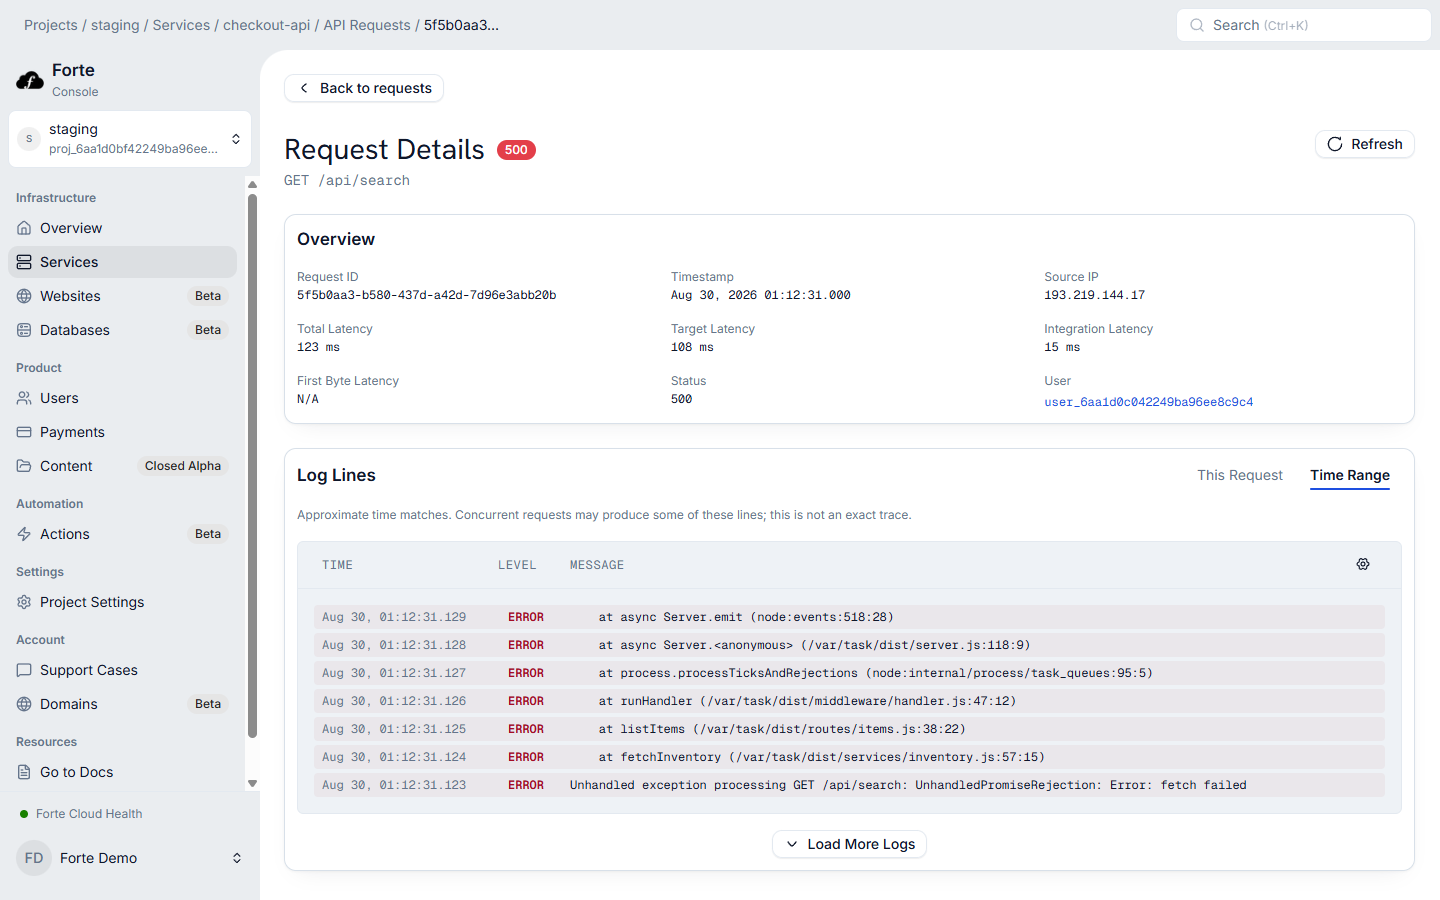
The data below is simulated, but the interaction follows the Forte console. Open the 500 response to inspect its associated log lines.
| Timestamp | Method | Path | Status | Latency (ms) |
|---|---|---|---|---|
| Feb 12, 03:45:18 | GET | /api/users | 200 | 45.20 |
| Feb 12, 03:45:19 | POST | /api/orders | 201 | 89.50 |
| Feb 12, 03:45:20 | GET | /api/products/123 | 200 | 32.10 |
| Feb 12, 03:45:23 | POST | /api/checkout | 500 | 1250.80 |
| Feb 12, 03:45:25 | GET | /api/cart | 200 | 28.30 |
| Feb 12, 03:45:27 | POST | /api/webhooks/stripe | 422 | 156.20 |
| Feb 12, 03:45:28 | GET | /health | 200 | 12.50 |
| Feb 12, 03:45:30 | GET | /api/orders | 200 | 51.70 |
Request and response body capture needs a deliberate privacy decision. It is enabled by default in Sandbox projects and disabled by default in live projects. If you enable it, review the data your application accepts and avoid retaining secrets or regulated content unnecessarily.
Forte can also associate logs by timestamp when an application has not adopted request IDs. That is a useful starting point for low-concurrency services, but it is less precise when requests overlap. Add request IDs before relying on correlation during a busy incident.
Turn the evidence into the next action
Use the customer's approximate time and route to narrow the request list, then open the failed call. Read the status and timing before inspecting the correlated log lines. An exception may point you to a query or downstream call; a slow request may need a closer look at dependency latency.
The immediate benefit is a shared record a developer and support engineer can discuss. They can identify the same request instead of exchanging screenshots from unrelated log searches. Use its application evidence to choose the next code or configuration investigation, then check subsequent requests after the fix.
Carry one request ID through the application
Forte injects X-Request-Id into requests sent to a Service. Read that header and put the value in every log line written for the request:
app.use((req, _res, next) => {
  req.requestId = req.headers["x-request-id"];
  next();
});

app.post("/checkout", async (req, res) => {
  console.log(`INFO requestId=${req.requestId} checkout started`);
  // Run the application operation.
  res.sendStatus(204);
});
Forte recognizes requestId, request_id, request-id, and x-request-id in application output. The value must use letters, numbers, and hyphens. See the monitoring guide for Node.js, Python, and Java examples.
Propagate the identifier when one service calls another. Otherwise, you have correlation within each process but no reliable way to follow one operation across services. For longer asynchronous workflows, store a separate operation or job identifier as well; an HTTP request ID describes one request, not an entire business process.
If you also investigate services in CloudWatch
Reduce the search space before reading log text. Record the time window, environment, HTTP method and route, response status, and any customer or tenant identifier that is safe to use operationally. Avoid putting passwords, credentials, payment details, or other sensitive values into log messages.
In CloudWatch Logs Insights, a first pass across the relevant log groups might be:
fields @timestamp, @message, @log
| filter @message like /ERROR|WARN/
| sort @timestamp desc
| limit 100
This is useful for discovery, but matching by time alone becomes ambiguous when a service handles concurrent requests. Once you find a request ID, search for that exact value across the participating log groups:
fields @timestamp, @message, @log
| filter @message like /abc123-def456/
| sort @timestamp asc
CloudWatch can run a Logs Insights query over multiple selected log groups. The remaining work is making sure each service emits the same correlation value and that the operator knows which groups to search.
Know what the evidence proves
A correlated request can show the status, latency, authenticated user context, and application output associated with one call. It cannot by itself explain every downstream dependency, reconstruct missing logs, or prove that an authorization decision was correct.
Use the tool that matches the question:
| Question | Useful evidence |
|---|---|
| Which endpoint failed and what did it log? | Request record plus correlated application logs |
| Where did time go across several services? | Distributed traces and propagated trace context |
| Which release introduced a recurring exception? | Error aggregation grouped by release |
| How did a customer move through the product? | Product analytics with an appropriate consent model |
| Did resource use approach capacity? | CPU, memory, instance, connection, and latency metrics |
CloudWatch, Sentry, Datadog, and similar systems can answer broader questions and may be appropriate as a system grows. Forte supplies a focused request-to-log workflow with its Service hosting, so a small team can start an investigation from the failed request without first assembling that view.
Make the next incident easier
Before an incident, verify that request IDs appear in logs, clocks use UTC, errors include useful context, and sensitive values are excluded. During an incident, narrow the failing requests before searching broadly. Afterward, add the missing evidence that slowed the diagnosis.
For the complete setup, open the Service monitoring guide. To see how Services are deployed and operated, review Forte Compute.